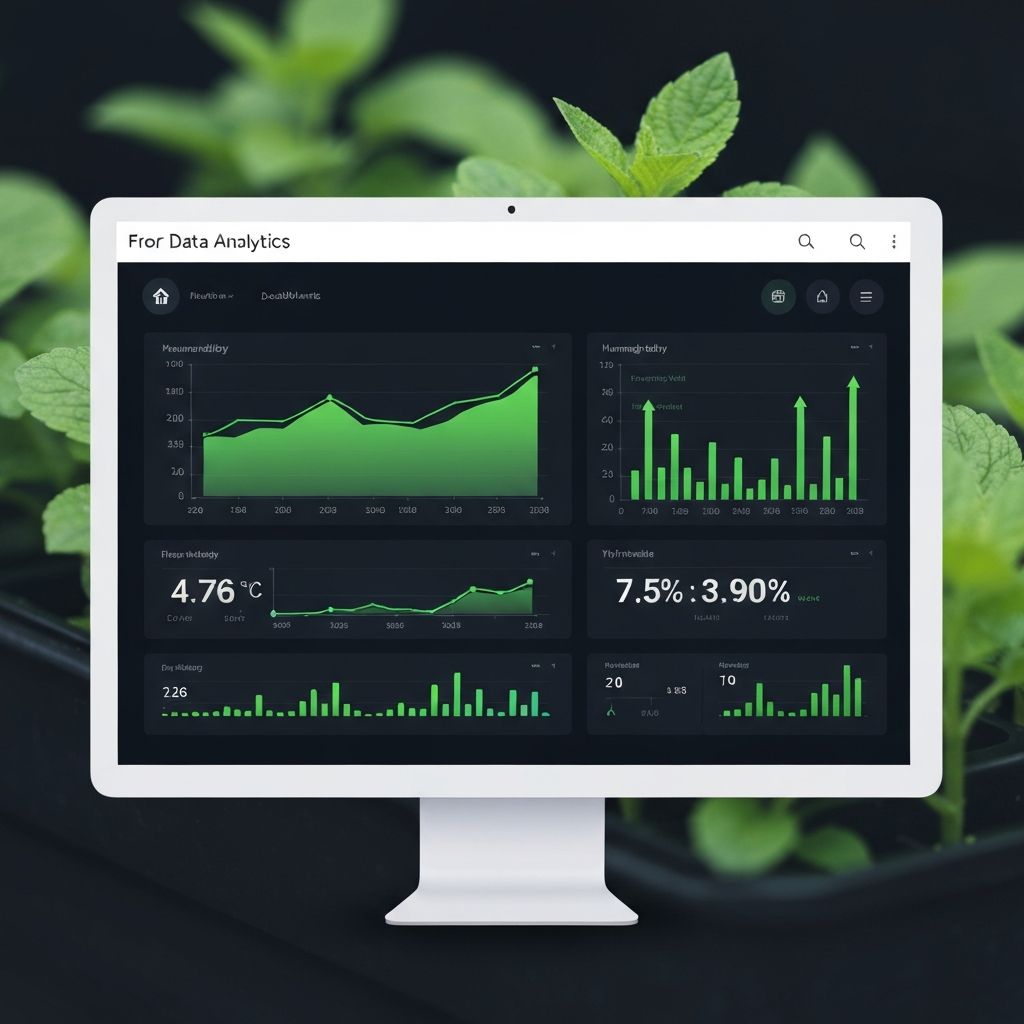
AgriHealth's dashboard provides powerful analytics to optimize your growing operation. Learn how to interpret the data and make informed decisions.
Dashboard Overview
Your analytics dashboard displays real-time and historical data across several key areas:
- Environmental Metrics: Temperature, humidity, CO2, VPD - Water Quality: pH, EC, water temperature - Plant Health: Growth stage tracking, health indicators - System Status: Irrigation, lighting, alerts
Key Metrics to Monitor
Temperature Trends Look for: - Consistent day/night cycles - Spikes indicating equipment issues - Gradual drift requiring calibration
pH Stability Healthy range: 5.5-6.5 Watch for: - Gradual drift (normal, adjust weekly) - Sudden changes (contamination alert)
EC Monitoring Target varies by crop and stage Watch for: - Rising EC (evaporation, add water) - Falling EC (plants consuming, add nutrients) - Spikes (overfeeding, flush system)
Using Historical Data
Trend Analysis: - Compare week-over-week growth - Identify optimal conditions from past successes - Spot recurring problems before they occur
Crop Comparison: - Track different varieties' performance - Optimize conditions for each crop type - Plan future plantings based on results
Setting Up Alerts
Configure alerts for: - Temperature outside 65-85°F range - pH outside 5.5-6.5 range - EC deviation >20% from target - Humidity outside 45-70% range - Equipment failures or offline sensors
Alert Best Practices: - Set thresholds with buffer room - Enable mobile notifications - Test alerts regularly - Don't over-alert (causes alert fatigue)
Data-Driven Optimization
Experiment Tracking: 1. Change one variable at a time 2. Document the change in notes 3. Monitor for 1-2 weeks 4. Compare to baseline data 5. Keep or revert based on results
Common Optimizations: - Adjust light schedules based on growth rate - Fine-tune nutrient concentrations - Optimize watering frequency - Modify temperature day/night differential
Pro Tips
- •Check your dashboard at least twice daily
- •Export data monthly for backup and analysis
- •Share dashboards with team members
- •Use mobile app for on-the-go monitoring
- •Set up weekly email summaries